June 2026

Welcome to the next jam-packed edition of Chisnell Chatter; your professional leadership briefing. This edition has a smorgasbord of items including the 80:20 rule in leadership, getting the most out of think-pair-share, and the Dr Fox effect. As always, please share with colleagues who may find this helpful.
This read will take you around 8 minutes; grab a coffee and a chocolate digestive (other choccy biccies are available).
Leadership and the 80:20 rule
School leadership can sometimes feel like spinning plates… while answering emails… while covering a lesson… while wondering who booked a parent meeting at 4:45pm on a Friday 🤯
Which is why the 80:20 rule matters. It’s a powerful leadership concept. Brace yourself for the leadership truth:
80% of your impact often comes from 20% of your actions.
Yet many leaders spend 80% of their time searching for the missing glue stick budget code, replying to “just a quick one…” emails, locating a child’s unnamed PE kit or attending meetings that could probably have been replaced by… an email.
Challenge yourself to think about what are the 20% of things that actually move your school forward?
✅ Being visible around school
✅ Coaching staff well
✅ Sharp curriculum thinking
✅ Developing culture and climate
✅ Knowing pupils deeply
✅ Having courageous conversations early
✅ Protecting time to think strategically
Not reorganising the shared drive for the sixth time this term ( Oh yes, I’ve travelled down that rabbit hole many times). Great leadership is often less about doing more… and more about doing what matters most, consistently.
Sometimes the most productive thing a school leader can say is: “No… that does not need a 47-slide PowerPoint.” So, challenge yourself to deal with the 20% of jobs that make a difference and be easy on yourself with the 80% that will have limited impact. And in that space left behind, there may even be time for a digestive and a cup of tea – now that’s where the strategic thinking really takes hold!
Ofsted admits the relationship between disadvantage and achievement judgements
School leaders working in challenging circumstances will quietly welcome Ofsted’s latest commentary on “achievement” and attainment data.
For too long, there has been a fear that headline numbers alone define the story of a school. Yet those leading communities with high disadvantage, SEND complexity, mobility and attendance challenges know the reality is far more nuanced.
The emerging direction of the 2025 framework appears to recognise this.
Achievement is not simply a score. It is:
• whether pupils can access the curriculum
• whether gaps are closing over time
• whether attendance is improving
• whether vulnerable pupils are included well
• whether leaders truly understand the barriers their children face
• and whether the school is building a culture where pupils can flourish.
This does not mean standards matter less. Far from it. But it does suggest that inspectors are increasingly interested in the quality of the journey alongside the destination.
Schools serving complex communities should therefore be ready to articulate:
➡️ the reality of their context
➡️ the barriers pupils face
➡️ the rationale behind strategic decisions
➡️ the evidence of improvement over time
➡️ and the lived experience of children in the school – particularly the inclusive groups (disadvantaged, SEND and those who have been supported by social care).
The strongest schools I work with do this exceptionally well. They combine ambition with humanity. High expectations with intelligent support. Strong curriculum thinking with deep inclusion.
A Schools Week article on this issue is here: https://lnkd.in/eN-4eiFi
Dr Fox effect – Charisma, knowledge and the curse of expertise by David Didau
David Didau’s article, “The Dr Fox Effect: Charisma, Subject Knowledge and the Curse of Expertise,” challenges some widely held assumptions about effective teaching and leadership in education. His central argument is that engaging performance should not be confused with learning, and that deep subject knowledge remains the foundation of effective teaching.
1. The Dr Fox Effect: We Can Mistake Entertainment for Learning – David revisits the famous 1970 “Dr Fox” experiment in which an actor delivered a lecture full of jargon, contradictions and nonsense. When delivered with charisma, humour and confidence, highly educated professionals rated the lecture positively despite learning virtually nothing.
The lesson is clear: people often confuse:
- Enjoyment with learning
- Engagement with understanding
- Confidence with expertise
- Performance with impact
2. Engagement is Not the Same as Learning – David argues that schools often place too much emphasis on visible indicators such as participation, enthusiasm and lesson engagement. Whilst these factors can support learning, they are poor proxies for whether pupils actually know more, remember more or can apply knowledge later. This has significant implications for lesson observations, instructional coaching and school monitoring.
3. Subject Knowledge Matters More Than Generic Teaching Skills – David challenges the belief that a “good teacher can teach anything.” He argues that deep subject knowledge and pedagogical content knowledge are more important than generic teaching techniques alone. Effective teachers understand:
- The structure of their subject.
- Common misconceptions.
- How novices learn.
- The sequence of knowledge pupils need.
4. Students Often Know When They Haven’t Learned – Interestingly, later research replicated the Dr Fox experiment and found that although students enjoyed charismatic presentations, many recognised they had not actually learned anything new. Enthusiasm may increase satisfaction but does not guarantee learning.
5. Beware the Curse of Expertise – David links this to his long-standing work on the “curse of knowledge.” As teachers become experts, they can forget what it is like to be a novice learner. Great teaching therefore requires not only expertise but also an understanding of how to make complex ideas accessible to beginners.
Implications for School Leaders
- Lesson observations should focus on learning, not performance.
- Teacher development should prioritise curriculum and subject expertise.
- Pupil engagement should not be used as the primary indicator of lesson quality.
- Monitoring should focus on what pupils know, remember and can do over time.
- Coaching conversations should move beyond generic pedagogy towards curriculum thinking and pedagogical content knowledge.
The Takeaway
The article’s core message is that charisma may win applause, but knowledge drives learning. Effective teaching is not primarily about being entertaining; it is about possessing and organising knowledge in ways that help novices learn, remember and apply it successfully.
For school leaders, this is a useful challenge to any evaluation system that confuses busy classrooms, engaged pupils or polished delivery with genuine learning. The question remains: What are pupils learning, remembering and able to do as a result? This links well to the article on ratio in a previous Chisnell Chatter here.
Read David’s full article here.
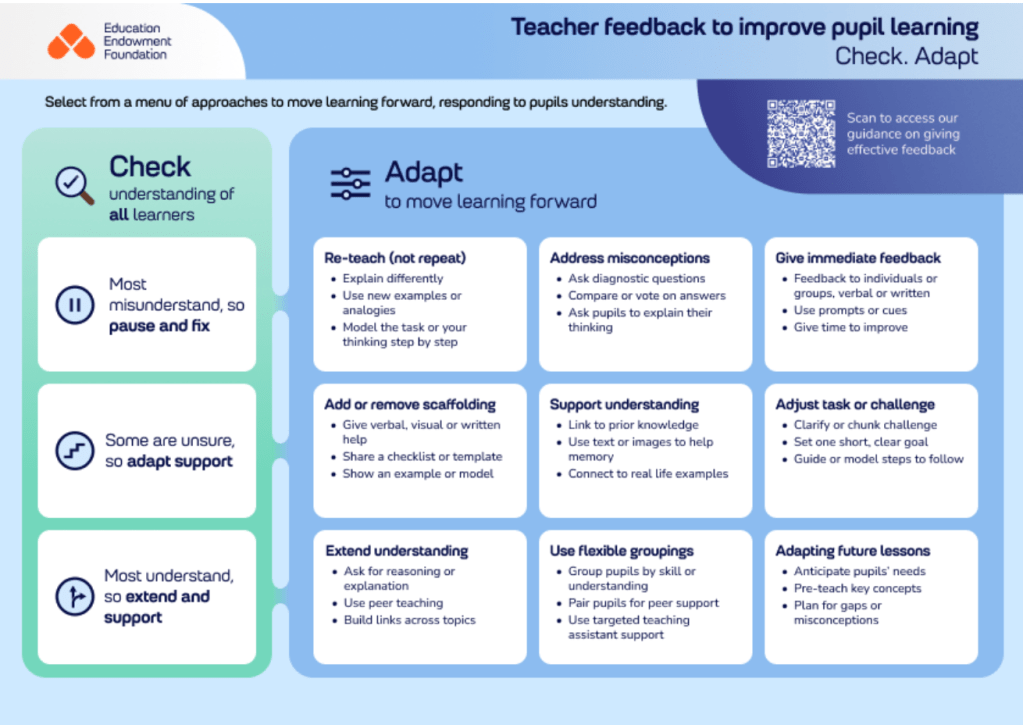
Teaching our children about Safeguarding
When I undertake safeguarding reviews for schools, I always focus in on how effectively schools teach children how to be safe. This is a dimension that is too often missed by more corporate compliance based reviews that I read as an Ofsted when inspecting schools.
Carolyn Flynn recently posted about this issue and provided a super safeguarding graphic below. In her post, she made some salient points. She states that if we teach children about road safety, fire safety and staying safe online; why do we wait until a safeguarding before we teach children about safeguarding?
When safeguarding becomes a concept that children understand early rather than a punitive concept; we encourage children to:
• look out for each other
• understand emotions
• recognise unsafe situations
• know how to ask for help
• create safe spaces to talk
• learn kindness, empathy, and healthy boundaries
So, take a look at her graphic below and think about your own PSHE programme, and ask if this fully addresses the points above. If it does, then bravo! If not, then think about how you can use your own contextual safeguarding issues to guide your curriculum design.

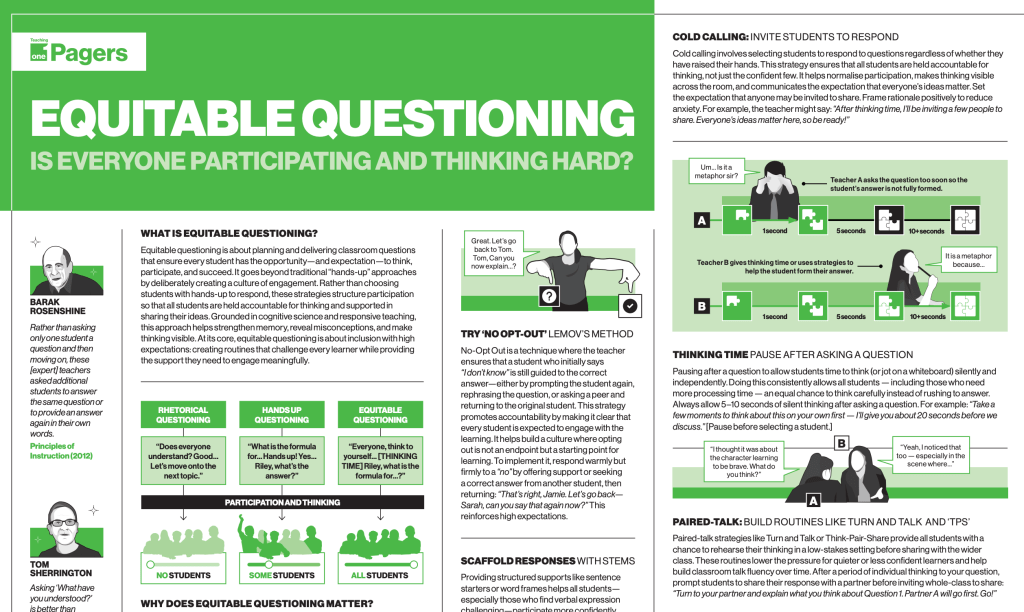
Getting ‘think-pair-shair right’ – Kate Jones and Dylan Willams
Kate Jones and Dylan Wiliam argue that Think-Pair-Share is a powerful classroom strategy, but only when each stage is deliberately structured. Too often, teachers rush the process, particularly the “think” phase, reducing its impact on learning.
1. Don’t Skip the Thinking – The most important stage is often the most neglected. Before pupils talk, they need sufficient time to think independently, retrieve knowledge and formulate their own response. This strengthens memory and ensures every pupil is cognitively engaged rather than relying on a partner’s answer.
2. Pairing Requires Listening, Not Just Talking – During the pair stage, pupils should actively listen to one another. Jones and Wiliam suggest structured roles (e.g. Partner A speaks, Partner B listens) and accountability measures such as asking pupils to report back on what their partner said. This improves attention and encourages deeper thinking.
3. Sharing Should Extend Thinking – When pupils share with the class, teachers should create pause time for reflection before moving on. The authors recommend the “Add, Build, Challenge” (ABC) approach:
- Add something new.
- Build on an existing idea.
- Challenge a response with an alternative perspective.
This ensures pupils listen carefully and engage critically with one another’s ideas.
4. Mini Whiteboards Can Strengthen the Process – Using mini whiteboards during the think phase encourages all pupils to commit to an answer, provides visible evidence of thinking and allows pupils to refine their ideas during the pair stage before sharing.
5. Ask Questions Worth Thinking About – The strategy takes time, so it should be reserved for important questions that probe understanding, stimulate discussion and focus on key learning. Poor questions lead to superficial conversations; rich questions promote deeper thinking and provide valuable assessment information for teachers.
Implications for School Leaders:
Effective Think-Pair-Share:
- Increases participation from all pupils.
- Strengthens retrieval practice.
- Develops oracy and listening skills.
- Provides teachers with rich evidence of pupil understanding.
- Activates pupils as learning resources for one another.
The quality of the thinking matters more than the activity itself. By slowing down the process, insisting on individual thinking first and structuring discussion carefully, teachers can transform a familiar routine into a powerful learning strategy.
You can read Kate and Dylan’s article in full here.
Attendance – get em in and get em learning!
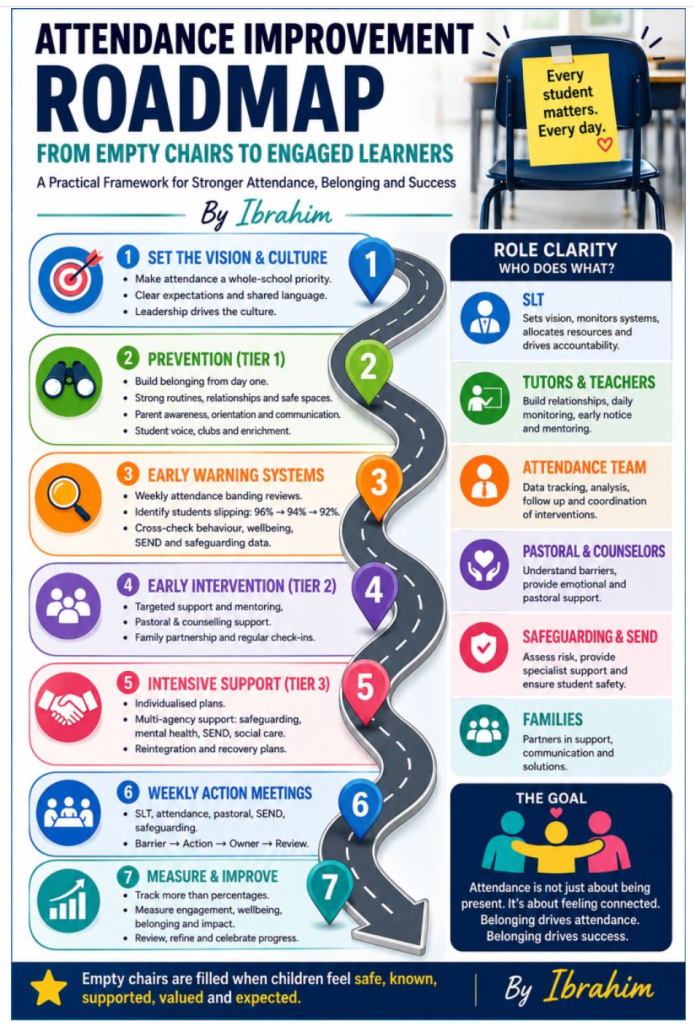
I have shared lots in my Chisnell Chatter about attendance. Here is a link to a my 30 leadership briefing on attendance that could be helpful for your team. Schools are being scrutinised deeply about their attendance in the new Ofsted framework. I recently came across Ibrahim who has produced a great little graphic on the roadmap to strong attendance.
Ibrahim Sanjaq suggests that attendance improves the fastest when school leaders stop asking the question, ‘how do we make students attend?’ but rather ask, ‘How do we make students feel connected enough to want to attend?’. His solution is to take these steps:
A practical roadmap could look like this:
1. Establish Whole-School Attendance Vision – Define attendance as a safeguarding, wellbeing and school climate priority. Create consistent language, expectations and leadership ownership.
2. Build Tiered Attendance Systems – Tier 1: Prevention, belonging, routines, parent awareness. Tier 2: Early identification and targeted intervention. Tier 3: Intensive multidisciplinary support plans.
3. Create Early Warning Systems – Weekly attendance banding reviews. Identify students declining from 96% → 94% → 92%. Cross-reference behaviour, wellbeing, SEND and safeguarding data.
4. Clarify Roles & Accountability – SLT drives culture and systems. Tutors build relationships and daily monitoring. Attendance teams coordinate follow-up. Counselors/pastoral teams address barriers. Safeguarding and SEND support complex cases.
5. Improve Student Belonging – Ensure every student is connected to at least one trusted adult. Expand mentoring, clubs, leadership and student voice opportunities. Reduce emotionally unsafe spaces and anxiety triggers.
6. Strengthen Family Partnership – Move beyond punitive communication. Build proactive parent engagement and early support conversations. Help families understand the long-term impact of absence.
7. Introduce Weekly Attendance Action Meetings – Every student discussed should have:
identified barriers, action plan, responsible adult, review timeline.
8. Measure Impact Beyond Percentages Track engagement, reintegration success, wellbeing,
participation, belonging, reduction in persistent absence.
Here is Ibrahim’s graphic:

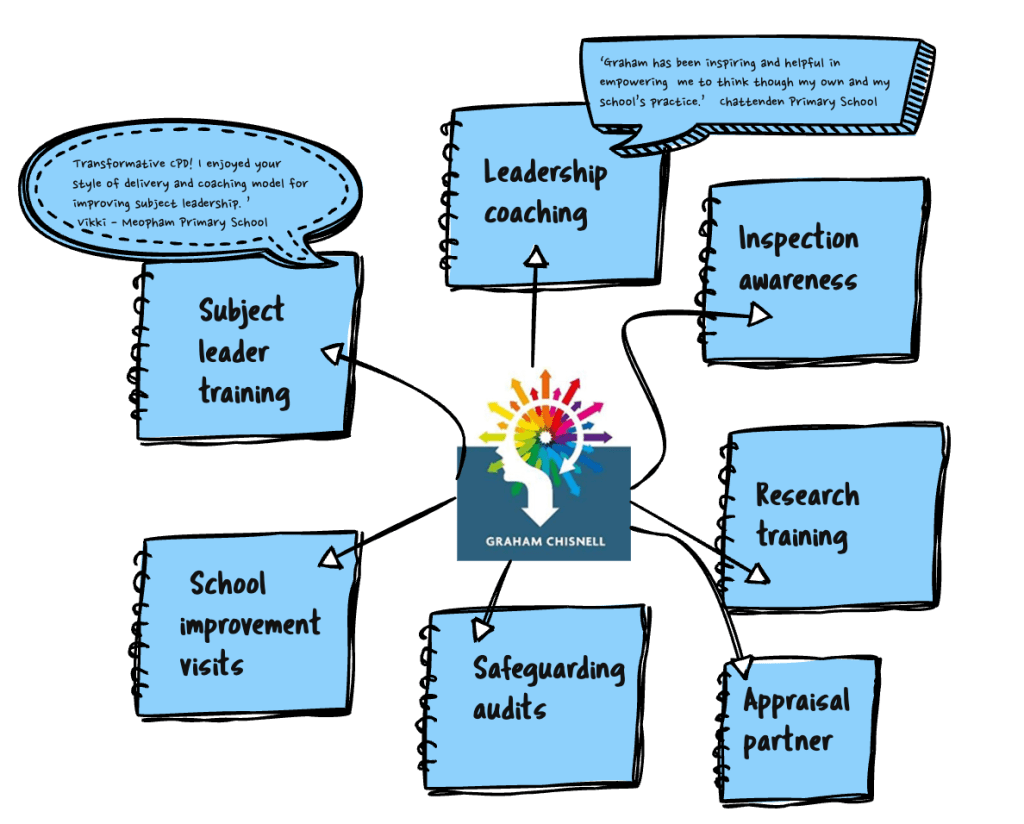
If you would like me to work with you then do get in touch. We can have a coffee and a chat. The graphic below shares some of the ways that school and trust leaders have used me in the past year. As always, happy to engage in bespoke work that suits your needs.
My work is gained by word of mouth so my final humble plea is that if you have valued my work then please share this with colleagues.